The Mind of Visualization
How Science Can Help Us Build Better Data Projects
Everyday Quirks
Our brains make us act in strange ways.
Waiting in Line

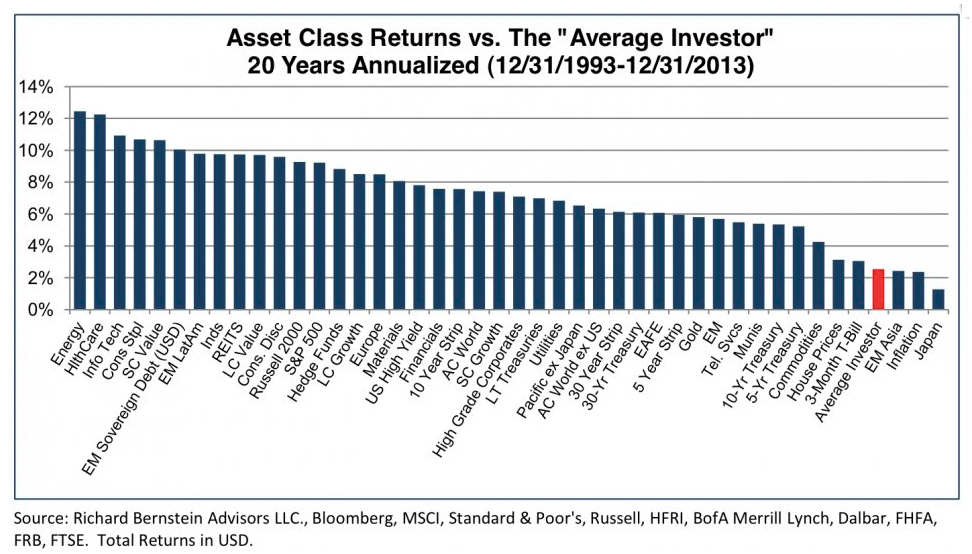
The Average Investor
What the Judge Ate for Breakfast (or Lunch)

"Our findings suggest that judicial rulings can be swayed by extraneous variables that should have no bearing on legal decisions."
137 Point Scale
“Exams will have a total of 137 points rather than the usual 100. This scoring system has no effect on the grade you get in the course, but it seems to make you happier.”
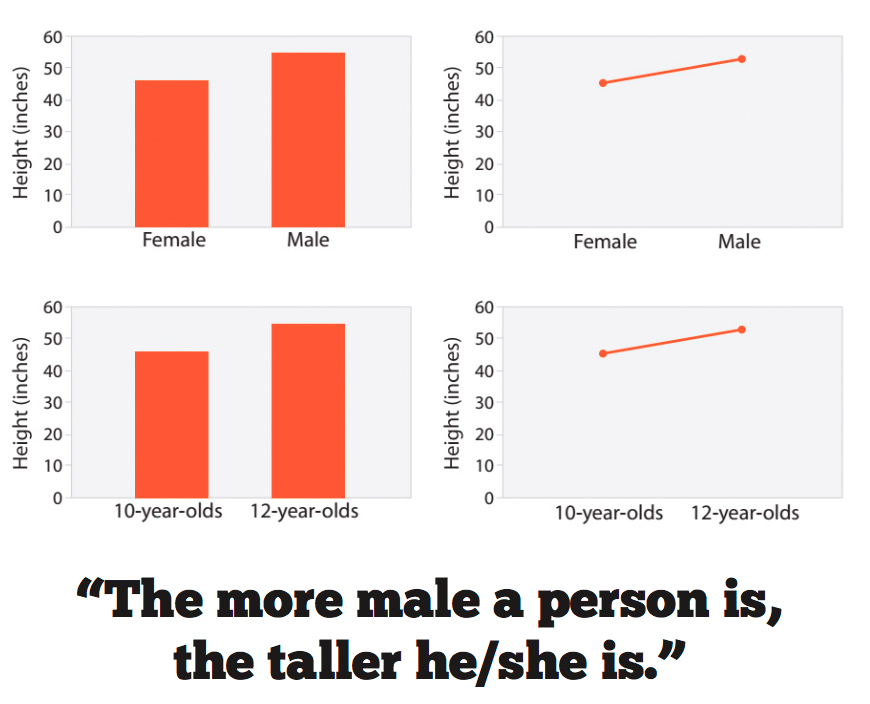
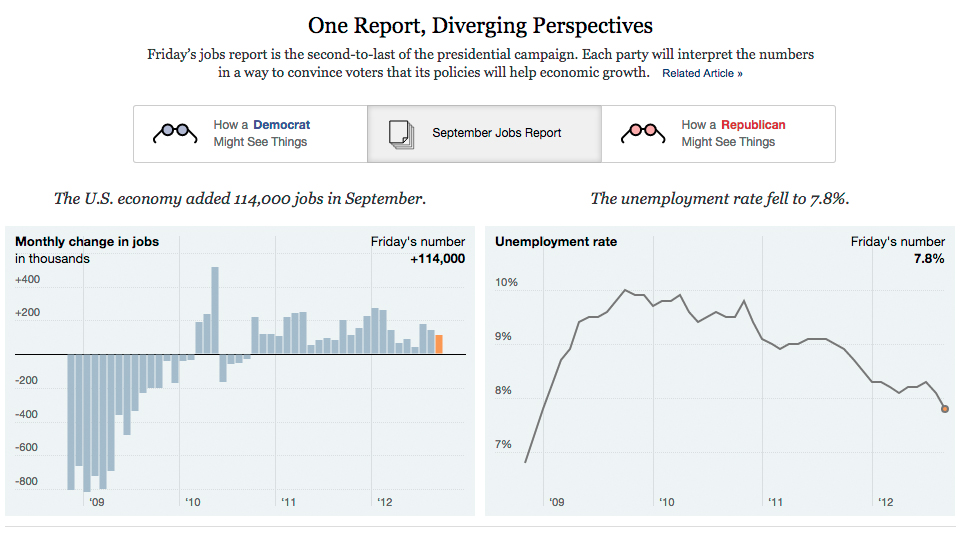
Framing
Visual Quirks
When it comes to visuals, things get stranger.
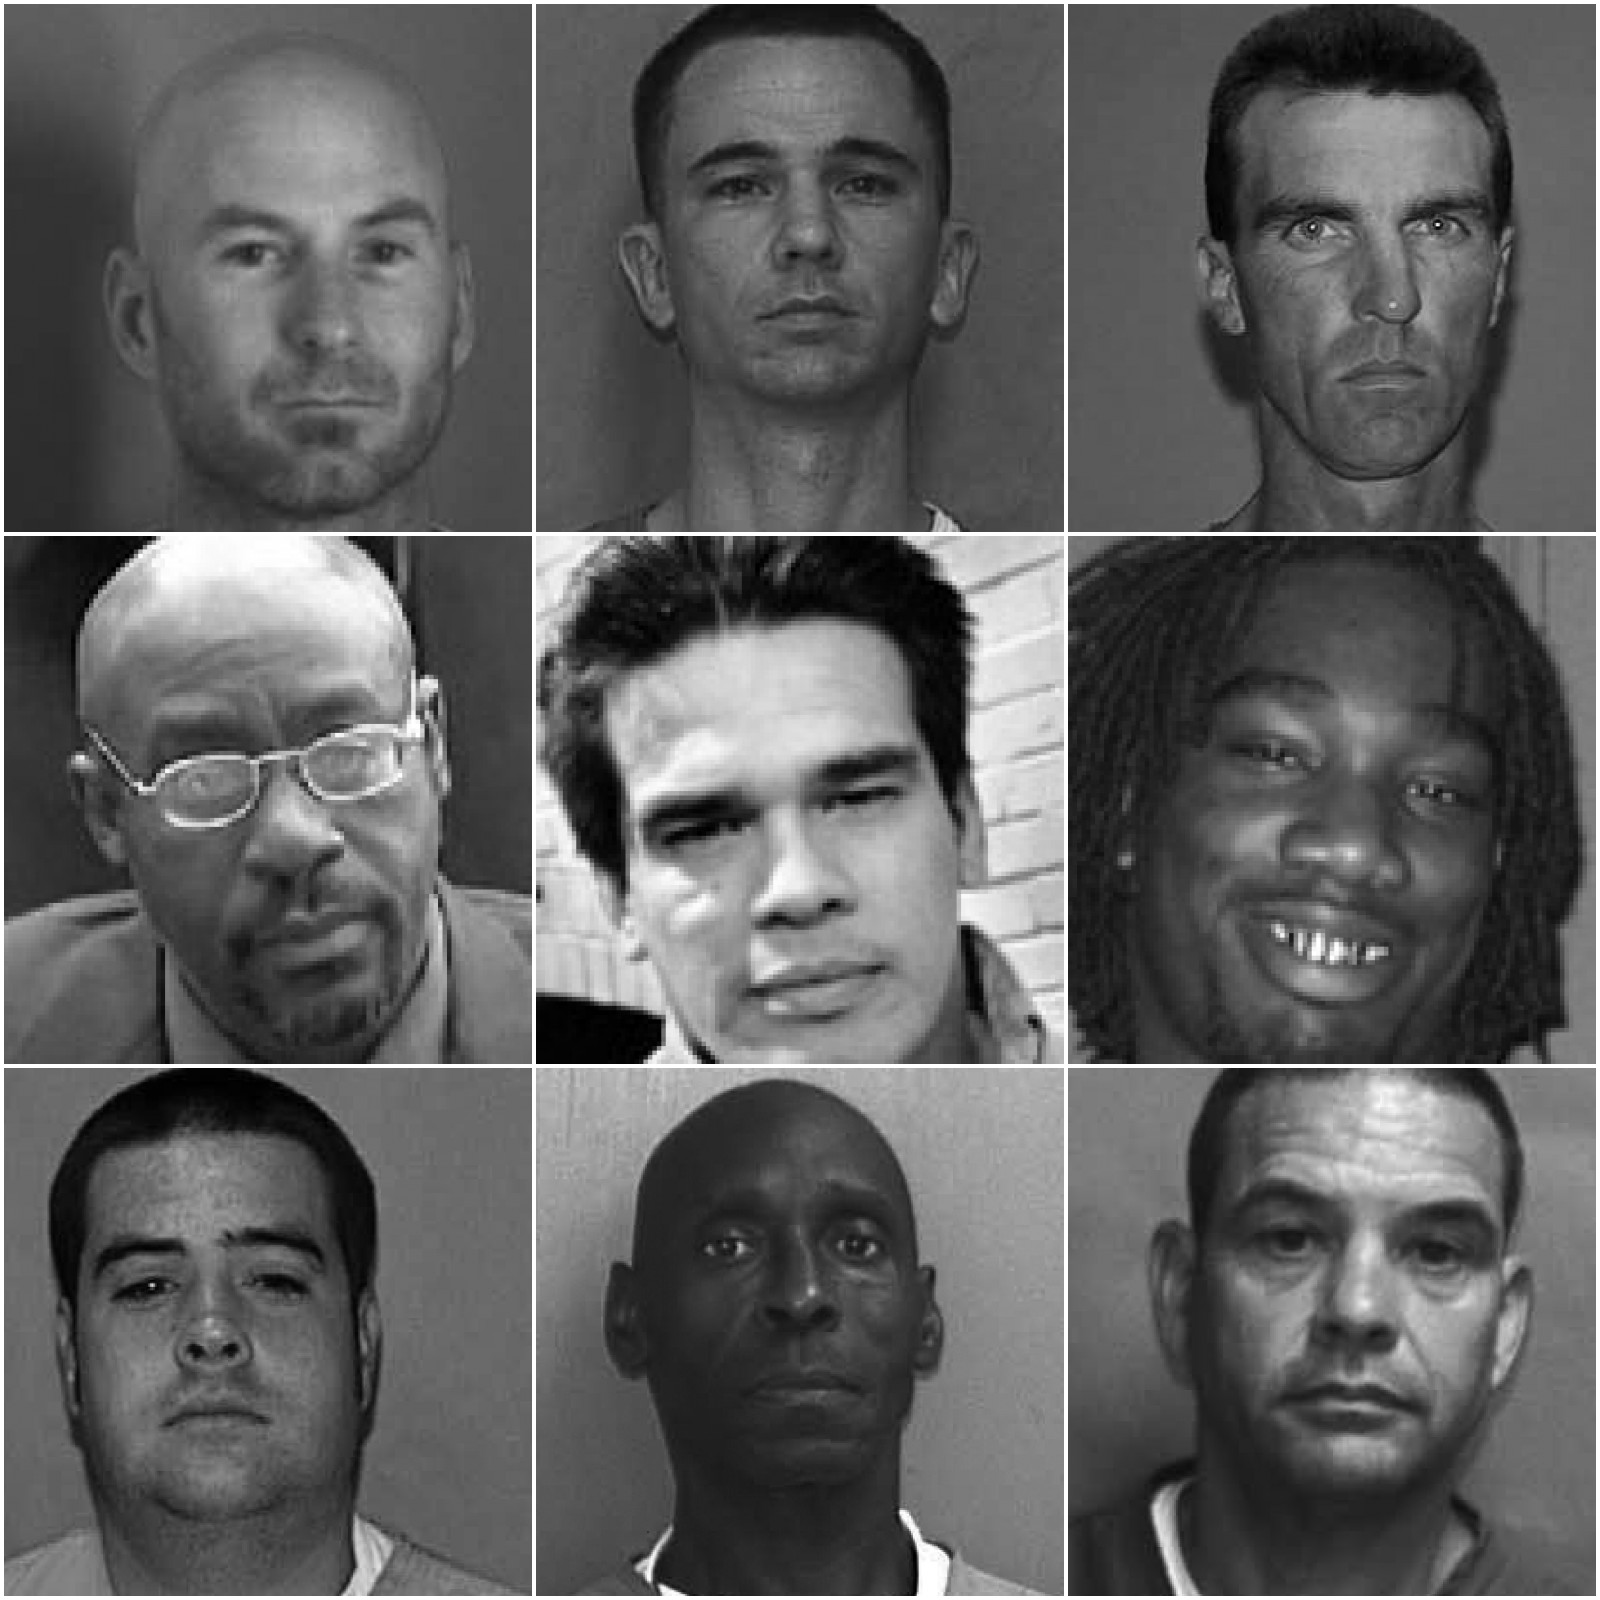
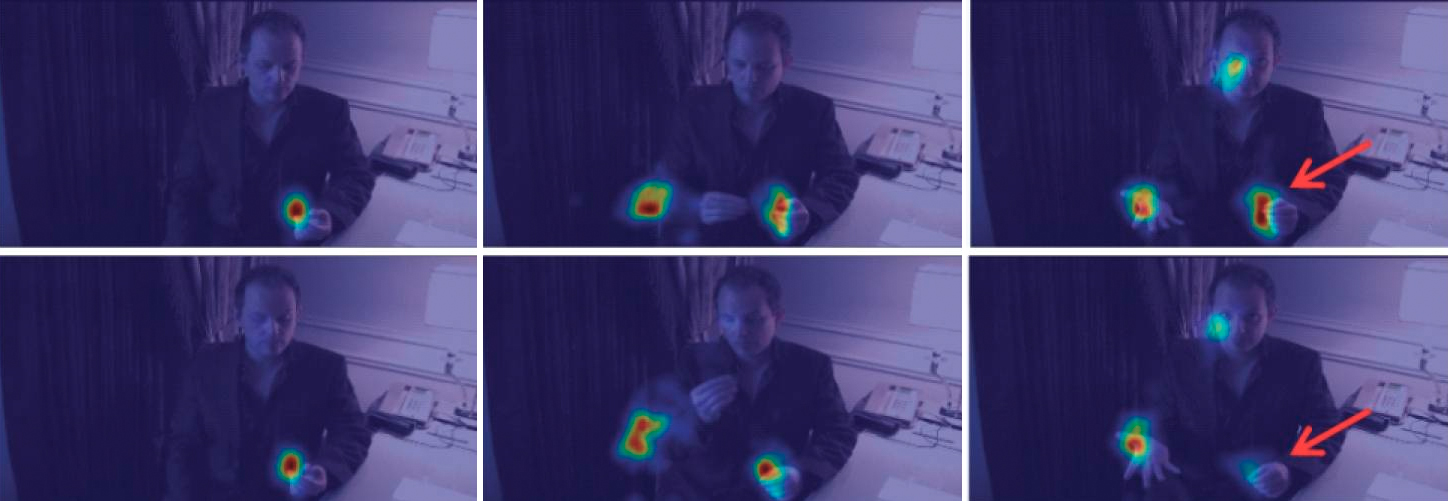
Judging a Face
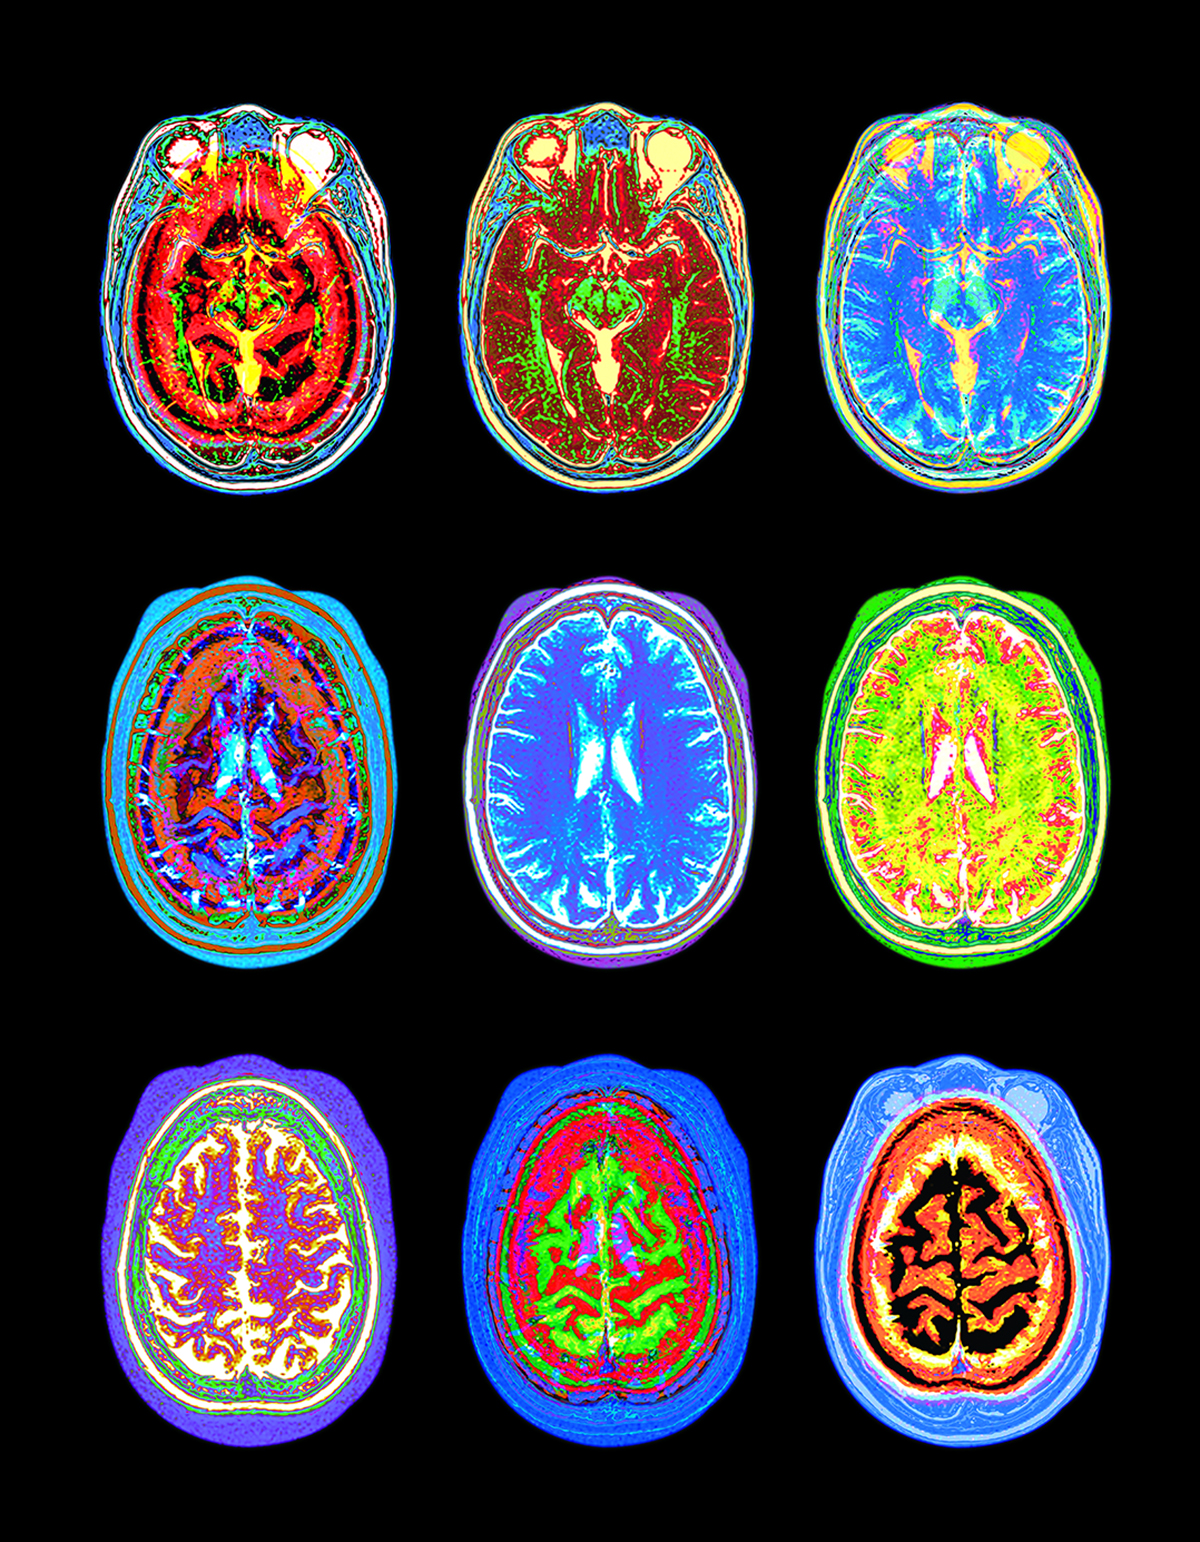
Swayed by Brain Scans
Better Aim...
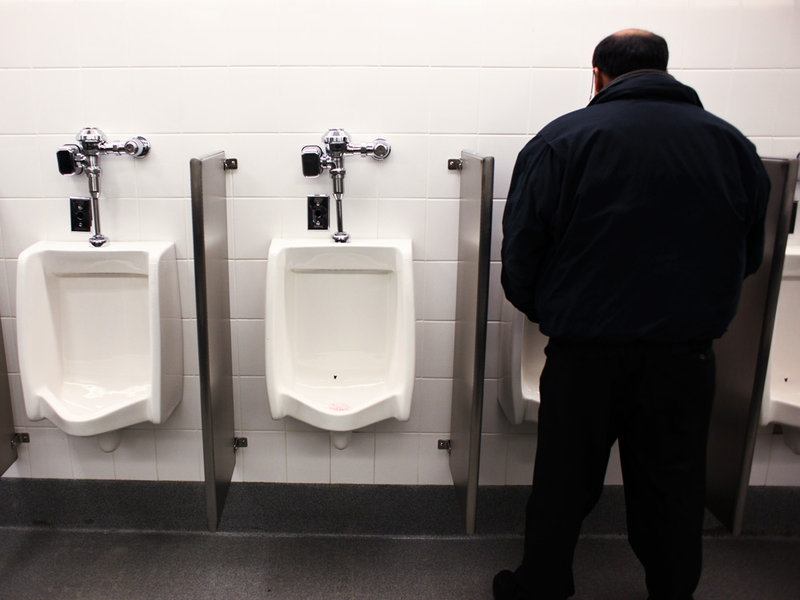
With a Fly!

Making Better Graphics
Using these mind oddities to build better graphics.
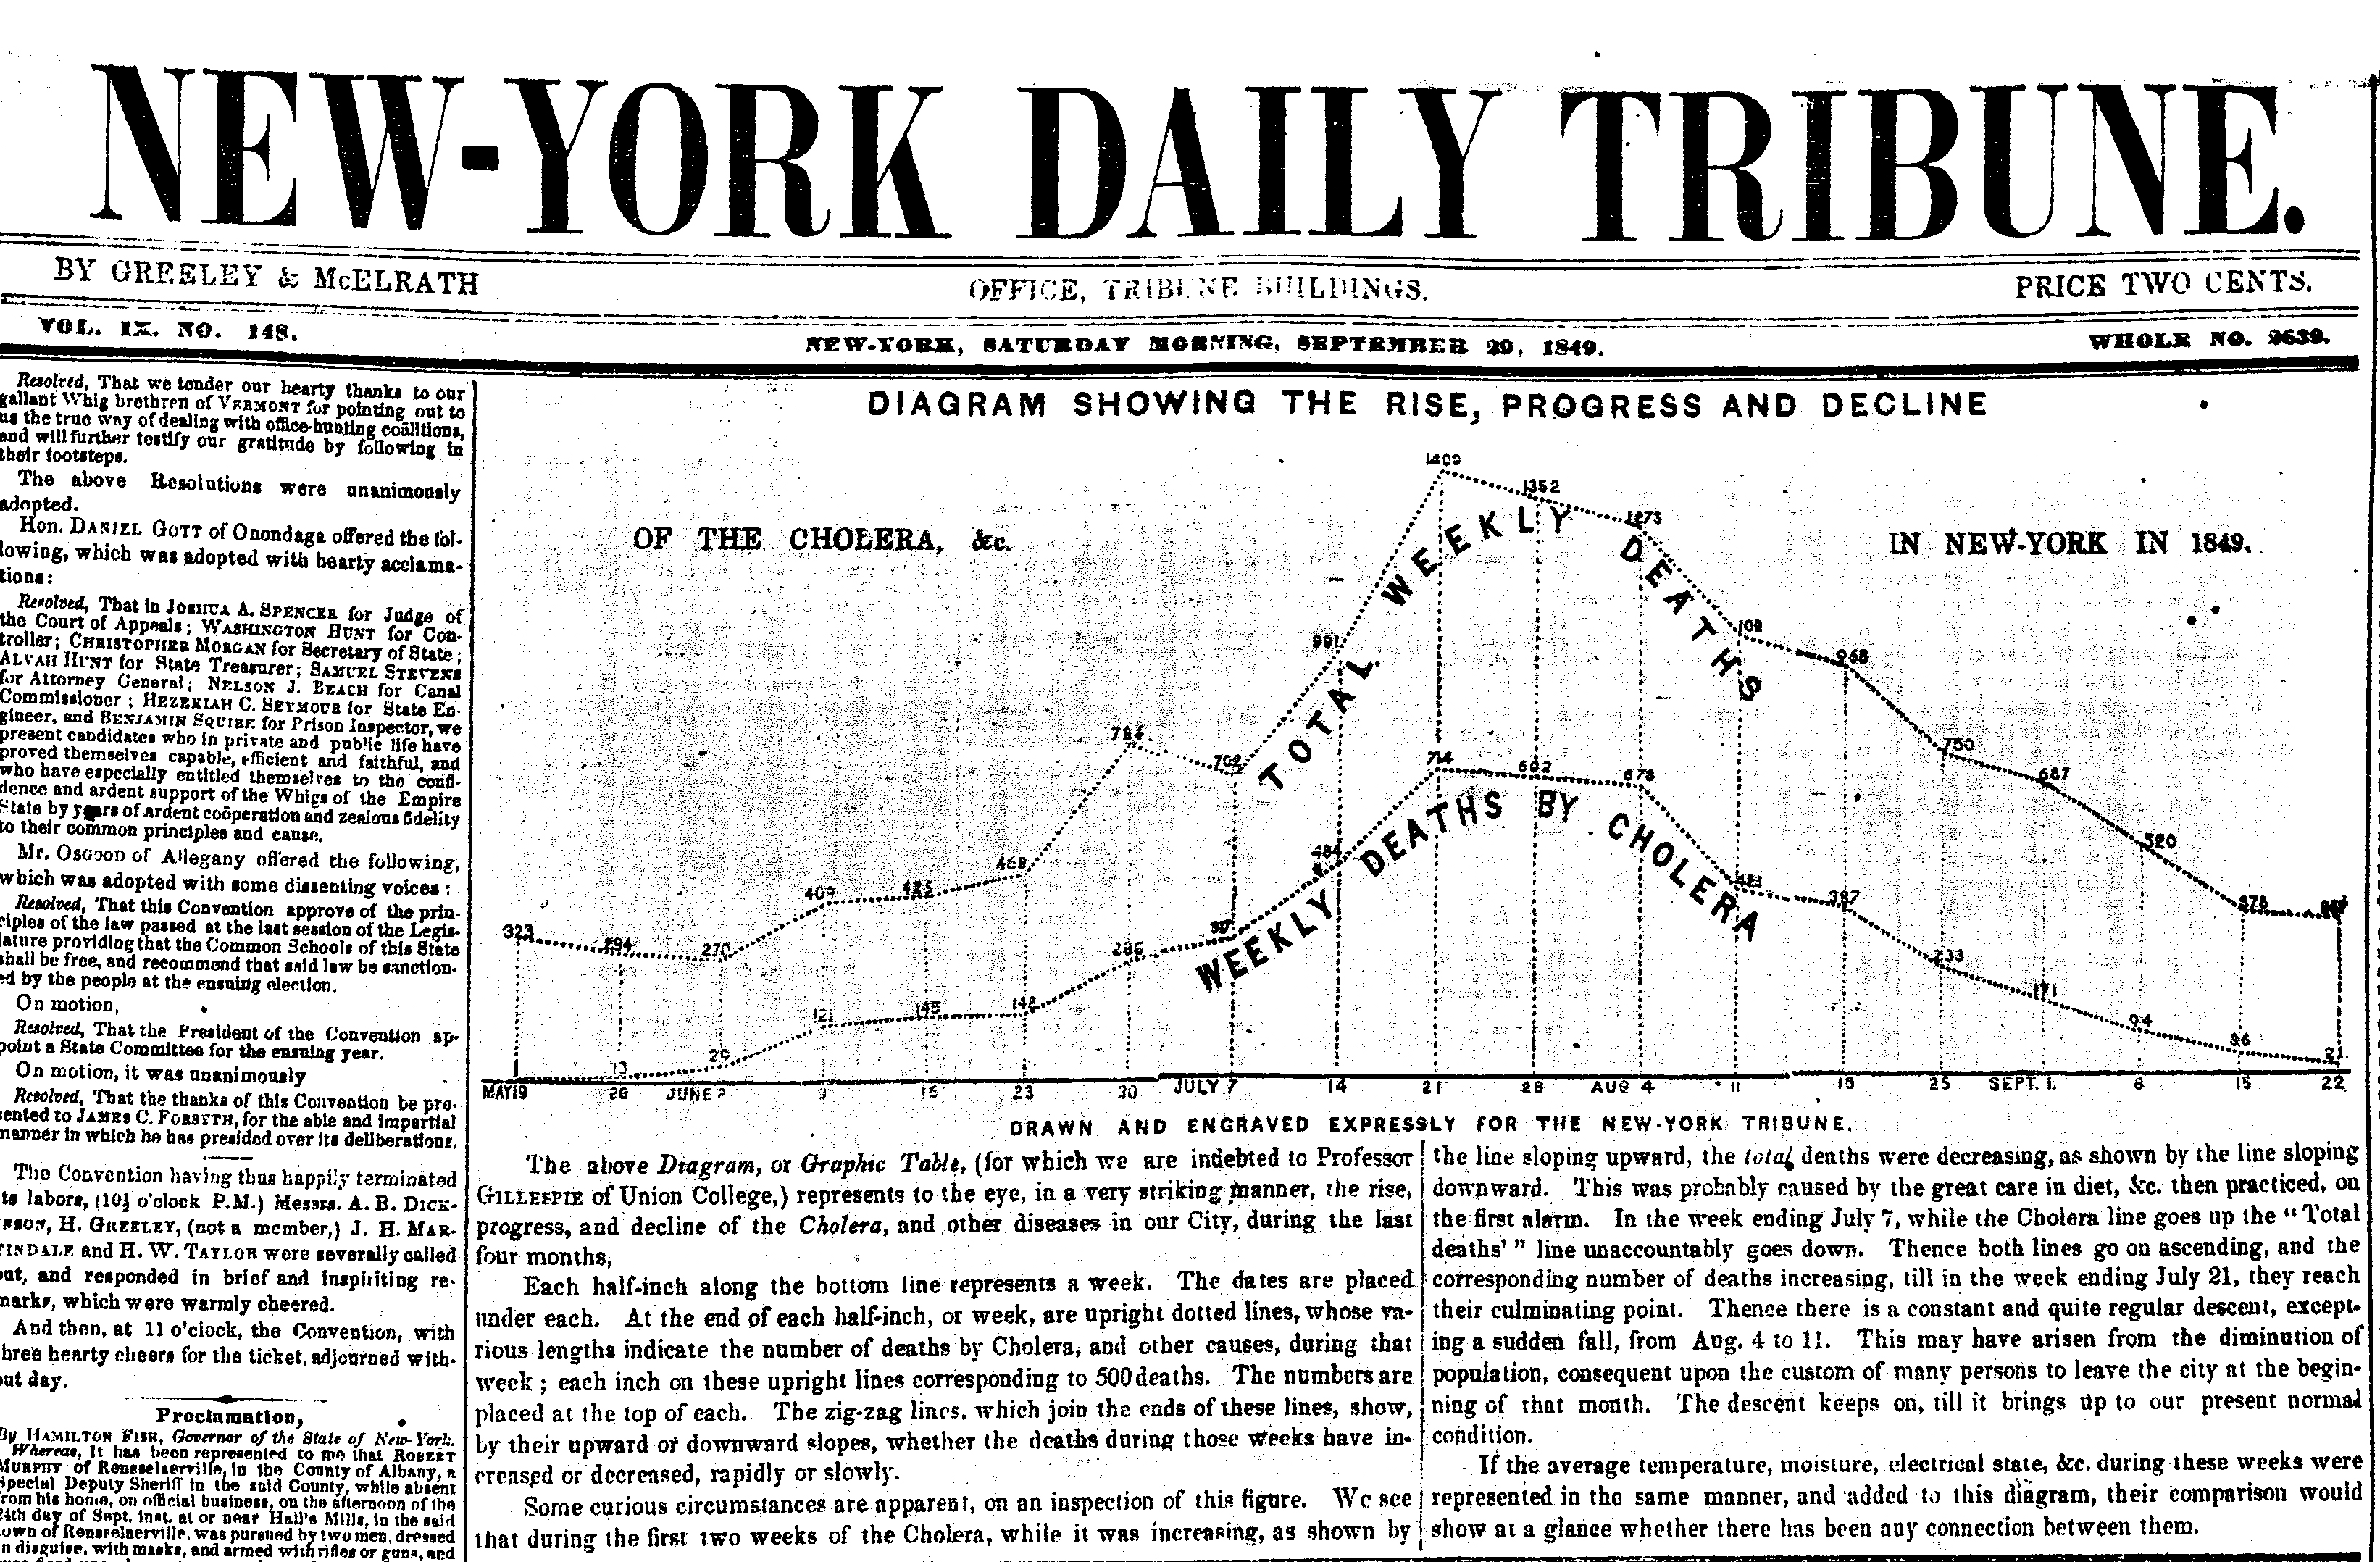
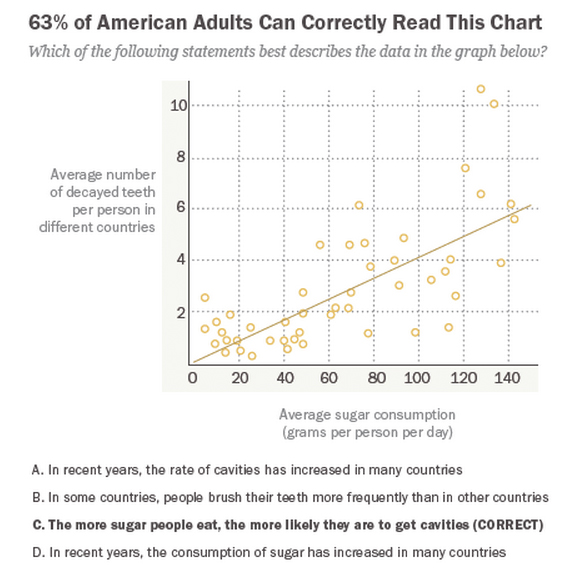
Learning to Read Charts
Still Not There
We Make Mistakes

Intuitions Are Strong
A Metric for Measuring Graphics

Graphical Perception: Theory, Experimentation, & Application to the Development of Graphical Methods.
William Cleveland & Robert McGill, 1984
Cartograms or Grid Maps
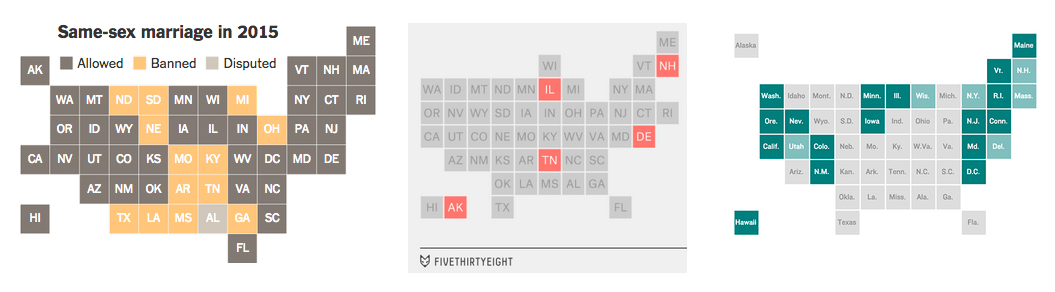
Orientation of a Map, Organization of a Table
Chernoff Faces
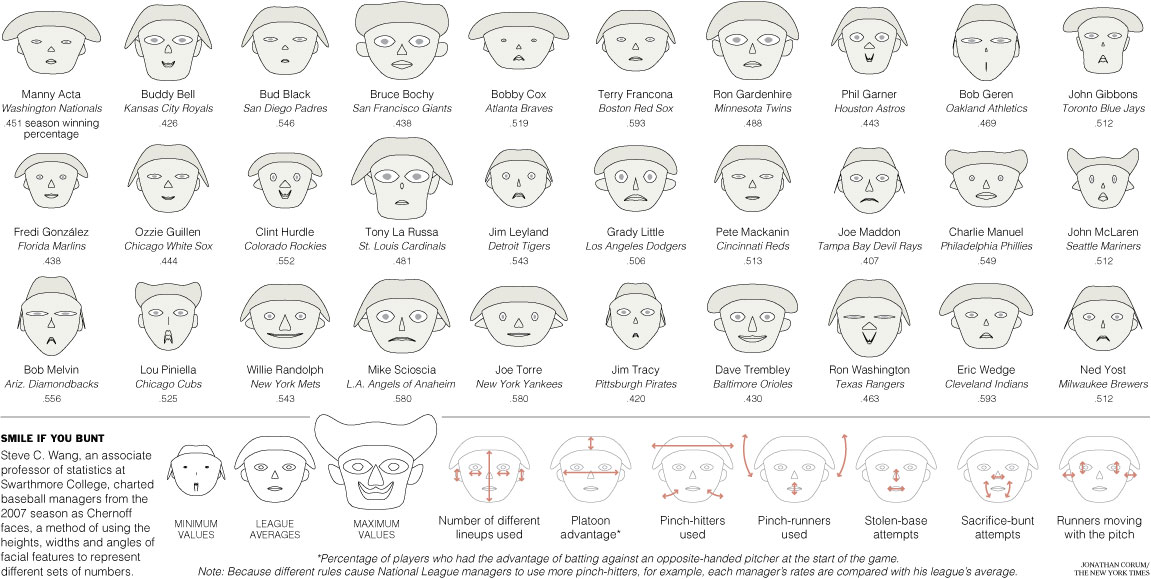
Body Parts

Revealing Our Minds to US
The long tradition of optical illusions.
Different Blues Look the Same
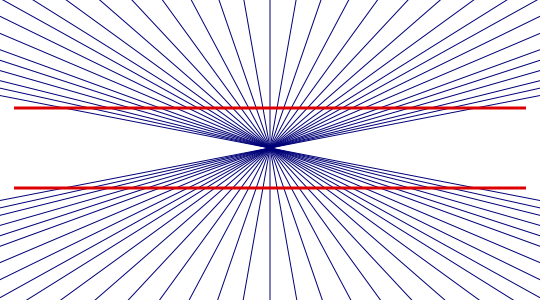
Straight Lines Look Curved
A Staggered Start Doesn't Look Fair

Ikea Nightmares
What About These Shades of Gray

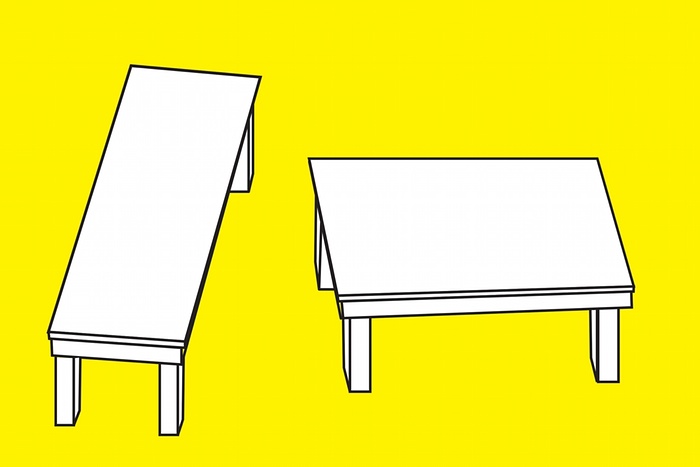
Lines That Don't Look the Same Length
Tables that Don't Look the Same Size
A Dancer That Spins Both Ways
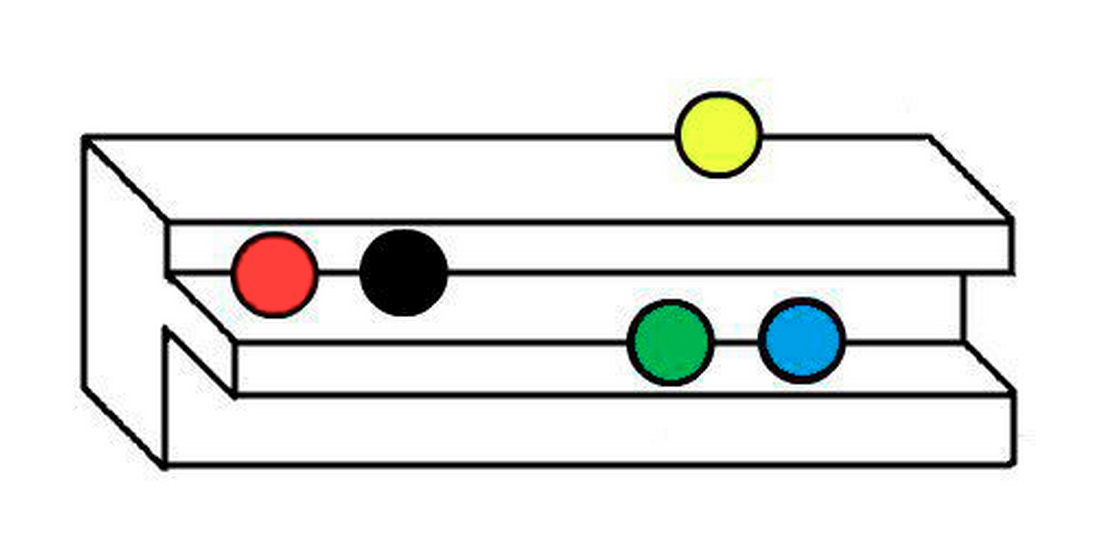
An Impossible Chocolate Bar

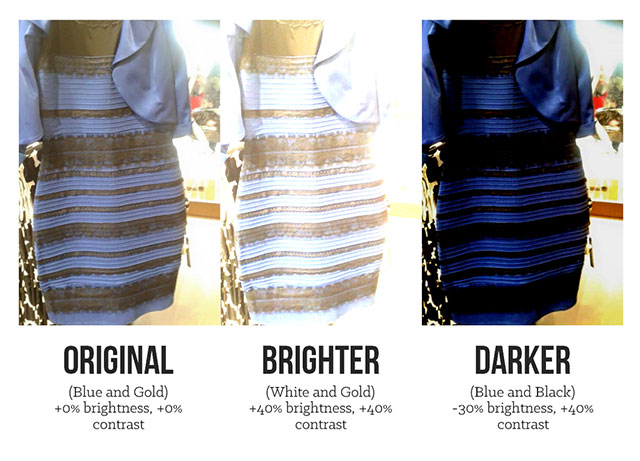
Blue or Gold?
Magic That Takes Advantage of Our Minds
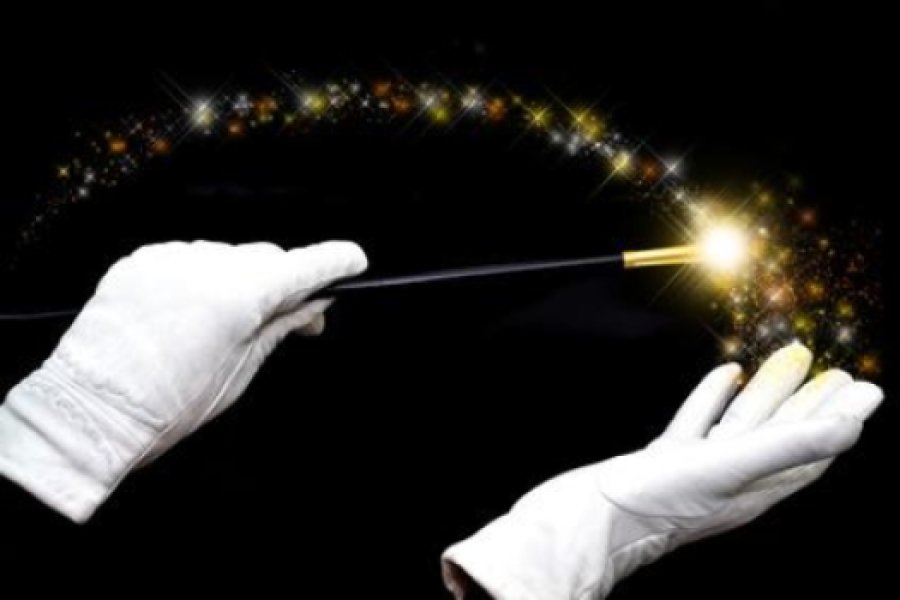
We Follow Curves, but Jump to the End of Straight Lines
Teaching Us About Ourselves
Using graphics to teach us about our own minds.
Showing Our Biases
Revealing Difficult Concepts by Doing
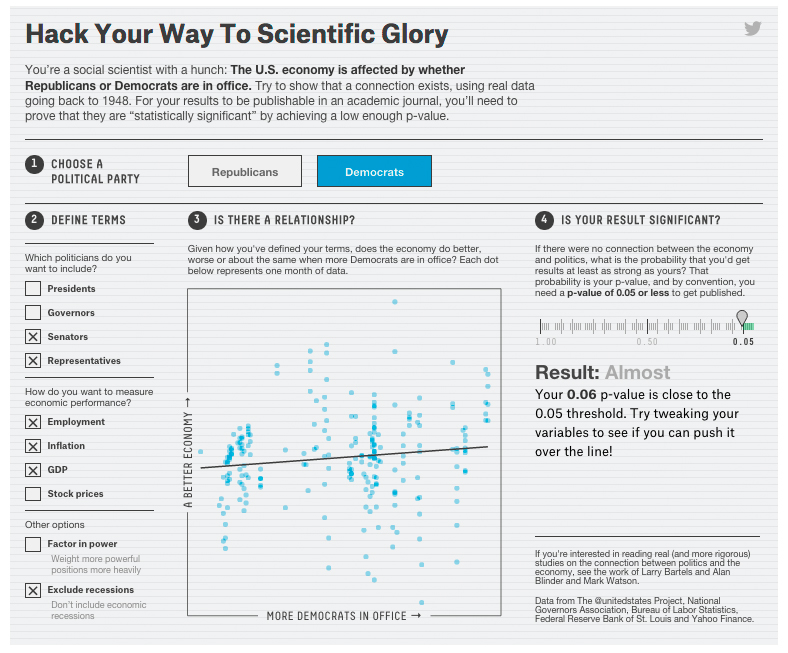
"For your results to be publishable in a journal, you’ll need to prove that they are 'statistically significant' by achieving a low enough p-value."
Playing with Our Expectations
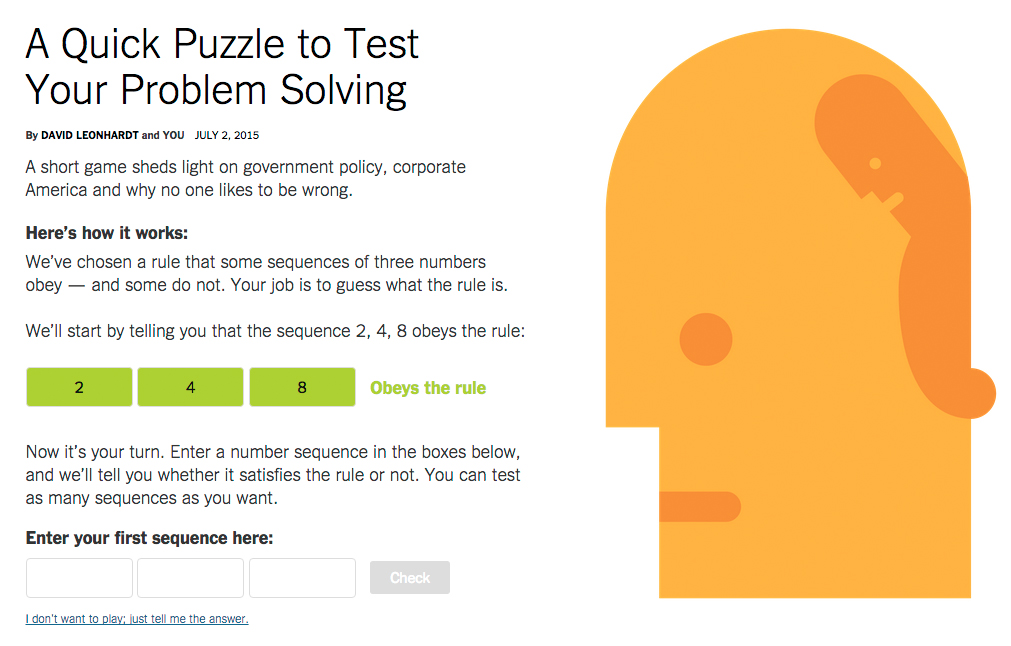
"We’ve chosen a rule that some sequences of three numbers obey — and some do not. Your job is to guess what the rule is."
Revealing our Limitations
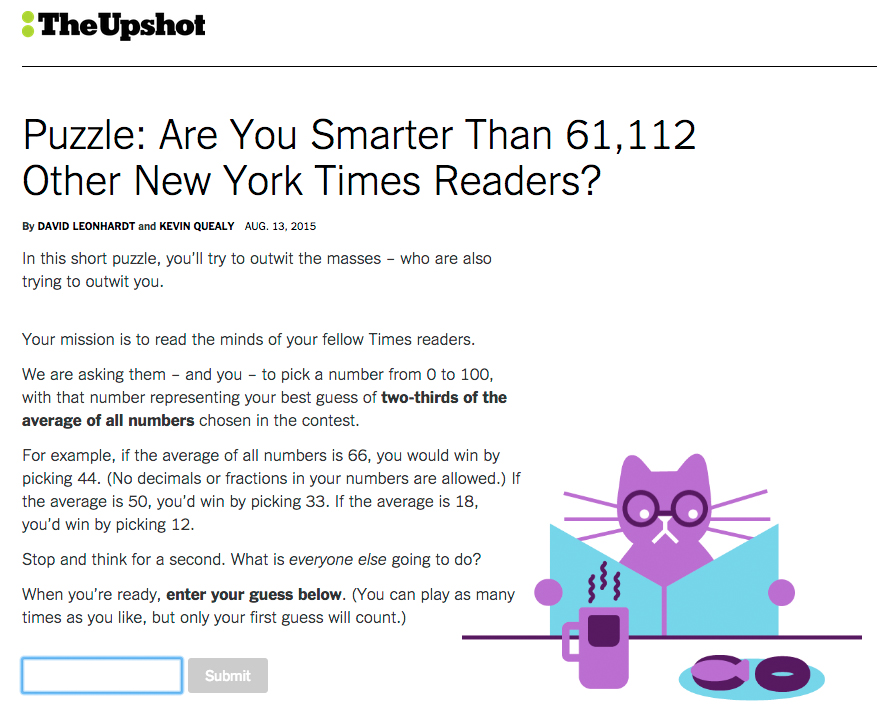
"Pick a number from 0 to 100, with that number representing your best guess of two-thirds of the average of all numbers chosen in the contest.
Teaching Us a Lesson

"I'll Move if Less than 30% of my neighbors are like me"
Thanks!
@lenagroeger